Hosted by the Department of
Economics, University of Peloponnese
Please read the Disclaimer
EurOil Index, Trading-by-Rotation
and TbR logos © 2007/2008 Dimitrios D. Thomakos
|
Historical Performance, Friday data |
An exercise in Trading by Rotation S&P500 &
VIX |
Historical Performance, Monday data |
|
Created and maintained by Dimitrios D. Thomakos, © 2008 |
||
|
Last updated: Trading updates available after Mon & Fri |
|
Figure on left updated on |
cumulative value of $1 over past
800 weeks, rolling window, rotation strategy, Friday data |
|
Figure on right updated on |
cumulative value of $1 over past 800 weeks, rolling window,
rotation strategy, Monday data |
In case the webpage is not promptly updated due to server
problems please check its mirror page at http://metronfinance.awardspace.com/rotation_sp500.html
|
Real Time TbR Strategy Performance (as cumulative value
of $1) |
From |
1.3291 |
|
From |
1.7565 |
|
|
Real Time Performance of S&P500 and the VIX (as cumulative value of $1) |
S&P500 |
0.9282 (Monday), 1.0218 (Friday) |
|
VIX |
0.9888 (Monday), 0.8619 (Friday) |
|
|
Sign Success Ratio (as %) |
Monday model: |
60.87% |
|
Friday model: |
65.22% |
|
|
Current recommendation (using data from
previous week) |
For |
S&P500 (1) |
|
For |
S&P500 (2) |
(1) Uniform recommendation across evaluation periods
(2)
Uniform recommendation across evaluation periods
|
|
Friday model |
Monday model |
||||
|
Real
Time Summary
Statistics |
TbR |
S&P500 |
VIX |
TbR |
S&P500 |
VIX |
|
Weekly average
return (as %) |
3.29 |
0.09 |
-0.60 |
1.43 |
-0.31 |
-0.05 |
|
Weekly std. deviation (as %) |
8.71 |
2.75 |
12.43 |
5.74 |
3.15 |
12.27 |
|
Weekly Sharpe ratio |
0.38 |
0.03 |
-0.05 |
0.25 |
-0.10 |
0.00 |
|
Maximum realized gain (as %) |
17.14 |
4.75 |
17.14 |
14.37 |
5.58 |
30.32 |
|
Maximum realized loss (as %) |
-13.56 |
-4.70 |
-18.12 |
-7.76 |
-7.76 |
-22.55 |
Visit another
Trading-by-Rotation webpage: Predictions
and TbR for Oil and the Euro
Visit my
blog: http://predict-and-trade.blogspot.com/
Click below to link on
this webpage:
Latest News, Summary of Trading Recommendations,
Introduction, Data, Methodology, Simulated Trading and Performance
![]() Summary of Trading Recommendations
Summary of Trading Recommendations
Based on data of the previous week
Recommended asset,
Monday data, for
Recommended asset,
Friday data, for
Welcome to the TbR S&P500 and VIX webpage! I continue,
with another class of assets, the research effort on rotation-based trading
strategies that I implemented and maintain in the EurOil
Index
and the TbR webpages. Here I use
the S&P500 equity index and the VIX index of its implied volatility. Very
illuminating discussions with Dr. Achilleas Venetoulias (who I would like to
thank without implicating) and Dr. Yianos Kontopoulos, the existing literature
and pure curiosity lead me to experiment with rotation between an asset and its
underlying volatility and, it turns out, the strategy works quite well! See
more in the discussion on performance below.
I am using data from publicly available, internet-based
sources. Weekly (Monday and Friday) data for both the S&P500 and VIX are
available online from Yahoo!
Finance. The data start on January 1990 (VIX availability).
The trading
methodology I am using here is based on some of my past research. I use a
modification of the methods presented in the paper ˇ°Market Timing and Cap Rotationˇ±, by D. Thomakos, T. Wang and
J. Wu, Mathematical and Computer Modeling
(2007), vol. 46, pp. 278-291 (available on http://www.sciencedirect.com),
to construct a trading strategy that rotates between the two assets based on their
predicted signs. The methodology can be seen as a generalized ˇ®sign
forecastingˇŻ approach although it is probably more informative than simple
pairwise sign forecasting. The strategy gives long-only signals and does not
take into account transactions costs so the results presented should be
interpreted accordingly.
A
rotation-based strategy will heavily depend on the choice of assets used in the
rotation. For example, the weekly drawdown will always equal the minimum return
among the two assets, if that particular asset is (wrongly) selected. Therefore
the strategyˇŻs success depends on whether it can correctly predict the relative
sign of the assets most of the time and note that we do not need to be
completely accurate all the time.
This is illustrated in the historical evaluation that I present in the next
section.
![]() Simulated Trading and Performance
Simulated Trading and Performance
Cumulative returns
|
Trading recommendation for Monday (based on data a week
before) |
Asset |
Realized Return % S&P500 |
Realized Return % VIX |
Sign Success Ratio |
Cumulative Sign Success Ratio (in %) |
Cumulative Value of $1 |
|
|
S&P500 |
-7.76 |
30.32 |
- |
0.00 |
0.9223 |
|
|
S&P500 |
3.26 |
-11.00 |
+ |
50.00 |
0.9549 |
|
|
VIX |
1.96 |
-6.66 |
- |
33.33 |
0.8883 |
|
|
VIX |
-3.06 |
6.01 |
+ |
50.00 |
0.9484 |
|
|
S&P500 |
0.72 |
-7.56 |
+ |
60.00 |
0.9556 |
|
|
S&P500 |
1.69 |
-10.54 |
+ |
66.66 |
0.9725 |
|
|
VIX |
-2.99 |
13.20 |
+ |
71.43 |
1.1045 |
|
|
S&P500 |
-4.45 |
11.15 |
- |
62.50 |
1.0599 |
|
|
S&P500 |
0.25 |
9.29 |
- |
55.55 |
1.0624 |
|
|
S&P500 |
5.58 |
-22.55 |
+ |
60.00 |
1.1182 |
|
|
VIX |
-2.03 |
-0.47 |
+ |
63.63 |
1.1135 |
|
|
S&P500 |
3.70 |
-13.30 |
+ |
66.66 |
1.1505 |
|
|
VIX |
-3.27 |
6.06 |
+ |
69.23 |
1.2111 |
|
|
S&P500 |
4.41 |
-15.01 |
+ |
71.43 |
1.2552 |
|
|
VIX |
0.59 |
-4.28 |
- |
66.66 |
1.2123 |
|
|
VIX |
0.79 |
-3.84 |
- |
62.50 |
1.1739 |
|
|
S&P500 |
-0.28 |
-6.05 |
+ |
64.71 |
1.1711 |
|
|
VIX |
1.63 |
-4.48 |
- |
61.11 |
1.1262 |
|
|
VIX |
-2.93 |
14.37 |
+ |
63.16 |
1.2699 |
|
|
S&P500 |
0.02 |
0.96 |
- |
60.00 |
1.2701 |
|
06/09/2008 |
S&P500 |
-1.74 |
15.35 |
- |
57.14 |
1.2527 |
|
06/16/2008 |
S&P500 |
-0.12 |
-9.85 |
+ |
59.09 |
1.2515 |
|
06/23/2008 |
VIX |
-3.15 |
7.76 |
+ |
60.87 |
1.3291 |
|
|
S&P500 |
|
|
|
|
|
[1.] The realized return for each asset is
the weekly return (from Monday to Monday) from the week before to the week of
the trade ¨C return measured as difference in log prices.
*Data for Tuesday the 27th ¨C
the markets were closed on the 26th.
|
Trading recommendation for Friday (based on data a week
before) |
Asset |
Realized Return % S&P500 |
Realized Return % VIX |
Sign Success Ratio |
Cumulative Sign Success Ratio (in %) |
Cumulative Value of $1 |
|
|
VIX |
0.4081 |
6.76 |
+ |
100.00 |
1.0676 |
|
|
S&P500 |
4.75 |
-18.12 |
+ |
100.00 |
1.1151 |
|
|
VIX |
-4.70 |
15.19 |
+ |
100.00 |
1.2670 |
|
|
S&P500 |
1.39 |
-11.11 |
+ |
100.00 |
1.2809 |
|
VIX |
0.23 |
-3.91 |
- |
80.00 |
1.2418 |
|
|
|
VIX |
-1.67 |
9.81 |
+ |
83.33 |
1.3399 |
|
|
S&P500 |
-2.84 |
3.51 |
- |
71.43 |
1.3115 |
|
|
S&P500 |
-0.40 |
12.53 |
- |
62.50 |
1.3075 |
|
|
S&P500 |
3.16 |
-15.75 |
+ |
66.66 |
1.3391 |
|
|
VIX |
-1.08 |
-3.48 |
- |
60.00 |
1.3043 |
|
|
VIX |
4.11 |
-13.56 |
- |
54.54 |
1.1687 |
|
|
VIX |
-2.78 |
4.40 |
+ |
58.33 |
1.2127 |
|
|
S&P500 |
4.22 |
-15.31 |
+ |
61.54 |
1.2549 |
|
|
VIX |
0.54 |
-2.72 |
- |
57.14 |
1.2277 |
|
|
VIX |
1.14 |
-7.47 |
- |
53.33 |
1.1530 |
|
|
VIX |
-1.83 |
6.55 |
+ |
56.25 |
1.2185 |
|
|
S&P500 |
2.63 |
-16.42 |
+ |
58.82 |
1.2448 |
|
05/23/2008 |
VIX |
-3.53 |
17.14 |
+ |
61.11 |
1.4162 |
|
|
S&P500 |
1.76 |
-9.21 |
+ |
63.15 |
1.4338 |
|
06/06/2008 |
VIX |
2.87 |
27.87 |
+ |
65.00 |
1.7125 |
|
06/13/2008 |
S&P500 |
-0.05 |
-10.46 |
+ |
66.66 |
1.7120 |
|
06/20/2008 |
VIX |
-3.14 |
7.49 |
+ |
68.18 |
1.7870 |
|
|
S&P500 |
-3.05 |
2.46 |
- |
65.22 |
1.7565 |
|
|
S&P500 |
|
|
|
|
|
[1.] The realized return for each asset is the weekly return
(from Friday to Friday) from the week before to the week of the trade ¨C return
measured as difference in log prices.
* Click on the link to see what happened intraday on the 22nd and
how the prediction went off by a last minute announcement
** Data for Thursday the 20th ¨C the markets was
closed on the 21st.
Discussion
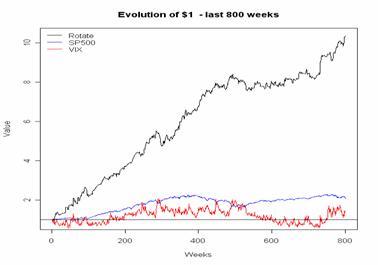
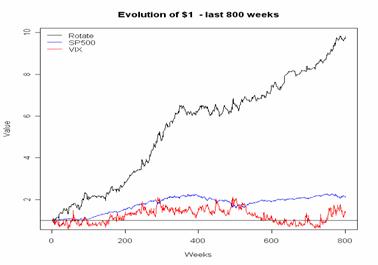
The
figures below summarize the trading performance of the proposed rotation-based
strategy vs. the performance of the S&P500 index and VIX. I present the
accumulated value of $1 invested at the beginning of different evaluation
periods and the corresponding information.
The strategy clearly outperforms both indices for all evaluation
horizons. The performance of the strategy is similar to the performance of the
same rotation strategy in the EurOil Index project, only that here we have
more data for evaluation and the cumulative values are much higher.
To
gauge the frequency of correct (and incorrect) decision-making of the strategy
I calculated the average number of times that the strategy picked the asset
with the highest (lowest) return. Surprisingly, these averages did not change
drastically with the length of the evaluation period, something that can be
considered a sort of ˇ®robustnessˇŻ property of the strategy. The average number
of correct decisions was about 56% (ranging from 53% to 58.5%). These numbers
are higher than the corresponding ones in Oil and Euro trading and can possibly
be attributed to the use of volatility in performing the rotation.
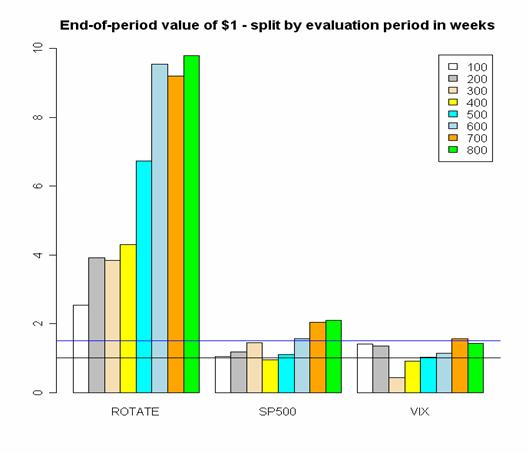
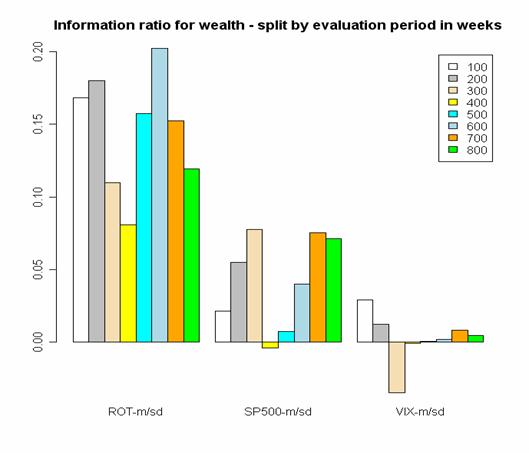
Figure 1 ¨C Monday data (updated

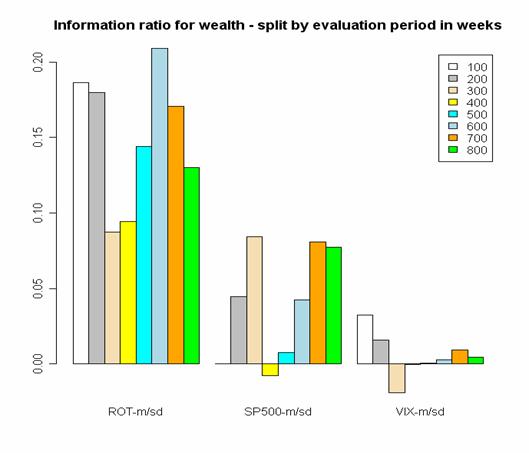
Figure 2 ¨C Friday data (updated
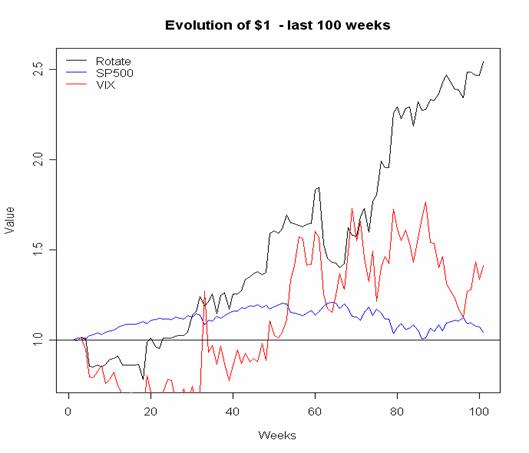
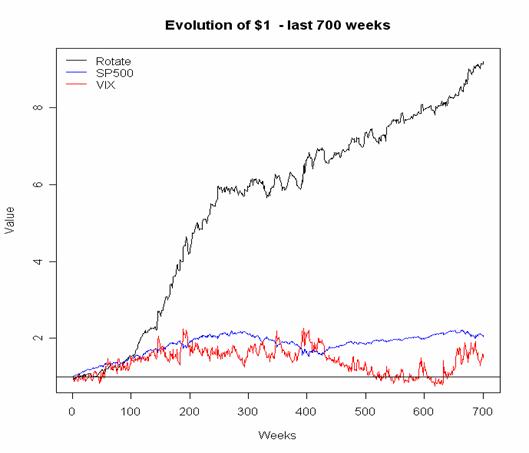
Figure 3 ¨C Monday data (updated
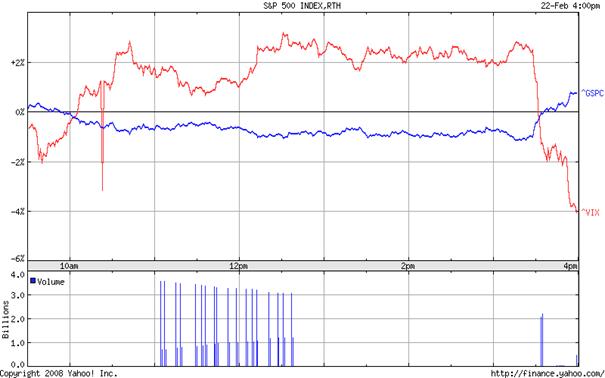
Figure 4 ¨C Intraday evolution of
S&P500 (^GSPC, blue line) and VIX (^VIX, red line) on
Disclaimer: The contents of this
webpage are provided for information purposes only. Prices shown in this
webpage are indicative and the author is not offering to buy or sell or
soliciting offers to buy or sell any financial instrument. The views in this
publication are those of the author alone and are subject to change at any
time, and he has no obligation to update the opinions or the information in
this webpage. The author of this webpage does not accept any liability
whatsoever for any direct or consequential loss arising from any use of the
information provided. The information in this webpage is not intended to
predict actual results, which may differ substantially from those presented.
The author is not affiliated with any of the companies used in the analysis
that is presented in this webpage.