Hosted
by the Department of Economics, University of Peloponnese
Please
read the Disclaimer
EurOil Index, Trading-by-Rotation
and TbR logos © 2007/2008 Dimitrios D. Thomakos
|
|
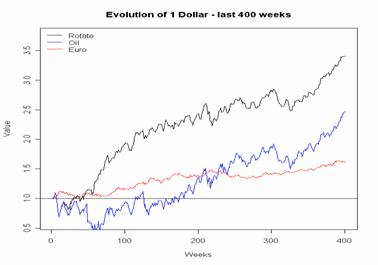
EurOil Index Trends, Forecasts and Simulated Trading for Oil and the Euro |
|
|
|
|
Created and maintained by Dimitrios D. Thomakos © 2007/2008 Last updated: |
|
|
|
|
Forecast
and Trading updates available after Wed each week Other
content updates as indicated |
|


Figure
on right updated on:
Visit
another Trading-by-Rotation website: TbR with S&P500 and
VIX
IMPORTANT: after 6 months of real
time evaluation I will not be updating the whole page but only the trading
recommendations of the models. For all the information, including methodology,
references, figures and performance of the past 6 months please link to the
saved webpage here!
In case the webpage is not promptly updated due to
server problems please check its mirror page at http://metronfinance.awardspace.com/EurOil_Index.html
![]() Summary
of Trend Forecasts and Trading Recommendations (scroll down for more,
including graphs with the strategies information ratios)
Summary
of Trend Forecasts and Trading Recommendations (scroll down for more,
including graphs with the strategies information ratios)
The historical
summary below until
|
Historical
Evaluation until |
Recommendation for
|
||
|
Cumulative
Returns |
Rotation #1 �C no cash (31 weeks) |
38.66% |
Euro |
|
Rotation #2 �C optimal
with cash (31 weeks) |
29.99% |
Euro |
|
|
Rotation #3 �C no cash,
re-optimized model (21
weeks) |
9.58% |
Euro |
|
|
GMV portfolio* (31 weeks) |
7.00% |
|
|
|
Oil (31 weeks) |
38.47% |
||
|
Euro (31 weeks) |
5.50% |
||
|
|
|||
|
Sign
Success Ratio |
Rotation #1 �C no cash (30 weeks) |
58.06% |
|
|
Weeks
in Cash |
Rotation #2 �C optimal
with cash (30 weeks) |
6 |
|
*GMV
== Global Minimum Variance
#Switch
from #2 cash strategy to #1 cash strategy
Real
Time Statistics of the TbR strategy and comparison with Oil and Euro
|
Summary Statistics |
Oil |
Euro |
No-cash rotation |
GMV portfolio |
|
Average weekly return (%) |
1.24 |
0.18 |
1.25 |
0.23 |
|
Weekly std. deviation (%) |
3.02 |
1.45 |
2.35 |
1.44 |
|
Weekly Sharpe ratio |
0.41 |
0.12 |
0.53 |
0.16 |
|
Minimum realized return (%) |
-7.70 |
-2.38 |
-5.06 |
-2.43 |
|
Maximum realized return (%) |
6.05 |
2.63 |
6.05 |
2.58 |
Trend Forecast Summary for the week of
[1.] Oil. A short-term sharp trend reversal
to within the standard error bounds is anticipated. The width of the standard error
band has been decreasing over the past weeks, a potential indicator that the
sharp rise of Oil prices is nearing an end.
[2.] Euro. The level of the series has
reached the lower bound of the trend prediction bands. The short-term trend
outlook now includes a further Euro depreciation before a reversal to within
the standard error bounds.
Disclaimer:
The
contents of this webpage are provided for information purposes only. Prices shown
in this webpage are indicative and the author is not offering to buy or sell or
soliciting offers to buy or sell any financial instrument. The views in this
publication are those of the author alone and are subject to change at any
time, and he has no obligation to update the opinions or the information in
this webpage. The author of this webpage does not accept any liability
whatsoever for any direct or consequential loss arising from any use of the
information provided. The information in this webpage is not intended to
predict actual results, which may differ substantially from those presented.